Go back
JACK IN THE BOX
Building a powerfully intuitive analytics practice for a national fast food chain: Turning data insights into dollars (and burgers).
KEY RESULTS
Improved organizational decision making
Improved user experience

PROBLEM STATEMENT
Jack in the Box lacked discipline around its measurement and analytics practice. Tracking and reporting was often incomplete and inconsistent, inherently starving the marketing team and key executive stakeholders and franchisees of much needed insights and strategic direction on how to get the most from their digital marketing experiences.
OVERVIEW
Jack in the Box engaged us to develop a holistic, ground-up measurement and analytics reporting strategy to address the needs of multi-disciplinary stakeholders and varying organizational teams. The goal was to make data easily accessible, provided actionable insights, and spur change that ultimately increases revenue and improves lifetime customer value.
OUR APPROACH
Assess current state of analytics
Meet with stakeholders to understand needs
Develop strategic roadmap for new analytics rollout
Establish systematic, holistic web strategy
Setup and implement Google Analytics & GTM
Create custom dashboards & data visualizations
Deliver ongoing insights & recommendations

Unifying teams around customer data
Meeting all organizational needs
Founded in 1951, Jack in the Box is among the nation’s leading fast-food chains, with more than 2,200 quick-serve restaurants in 21 states. In addition to its national campaigns, internal teams work to reach local markets and cater to the tastes of each region.
Omnichannel marketing needs are complex, and like similar organizations founded prior to the dotcom boom, the transition to digital experience marketing has been a slow and organic process. As such, up until this time web measurement was only implemented as needed and solely focused on the specific KPIs of each managing team - resulting in a disjointed measurement practice, a lack of categorization and gaps in tracking and analysis techniques.
Through working with each team, we developed a full understanding of how data could be used organizational to make decisions, and laid a robust, scalable framework for data collection as well as a reporting and insight cadence that would maximize relevant insights to quickly reflect, and apply learnings and improve performance moving forward.
A synchronized rollout of Google Tag Manager
A comprehensive project plan was established to adopt and integrate new analytics technologies. We connected historical with new data sets, ensuring marketing teams were attributing traffic correctly, established data integrity monitoring systems, and implementing an ongoing process to adjust and scale to web and marketing changes.
Web analytics tracking, previously implemented directly within the page structure, required a development resource to make updates and changes, ultimately resulting in a lack of adequate tracking. As part of our rollout, Google Tag Manager was ushered in and a new web measurement framework was implemented including the tracking of both macro and micro-interactions. Teams were also empowered to implement new tracking within GTM, following our established measurement framework and naming conventions.
Taking action with data
A rapid iteration approach to performance dashboarding
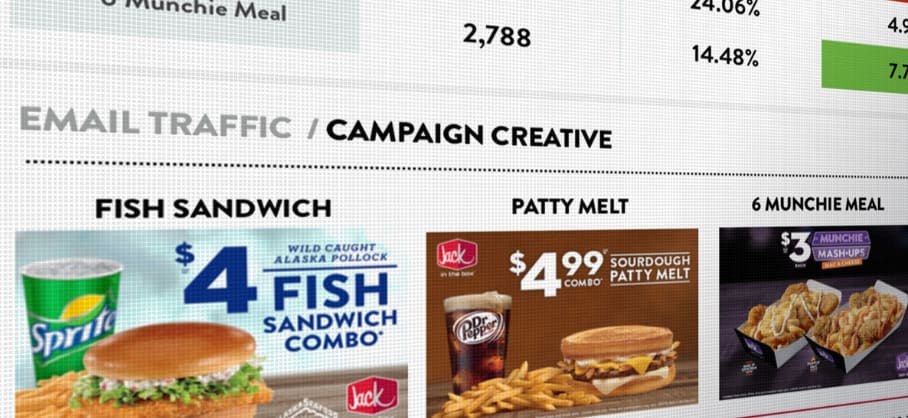
The Jack in the Box website receives nearly 2 million sessions per month. With so many user interactions, the opportunity for deep analysis and insights was immense. We were able to surface trends quickly. Focusing on high priority areas, we created an initial report to clearly showcase site health, funnel metrics, and channel performance to empower quick action.
The result has been a continually refined reporting process that is efficient, insightful, and actionable, all while catering to individual as well as organizational needs.
Embracing a culture of ongoing optimization
The insights our analysis and reporting dashboards helped Jack in the Box’s teams better understand their customers and the performance of their marketing efforts. As opportunities were identified, recommendations were made—including marketing campaign strategies, web feature and design enhancements, a/b test ideas, and personalization opportunities. Continually using data to identify optimization opportunities quickly gained momentum and are now a critical component of all JITB’s reporting.
Reporting insights have lead to significant improvements in the site’s navigation, location finder feature, offers funnel, and email subscriber paths, as well as numerous bug fixes and updated SEO practices contributing to incremental gains in web performance.
Can’t stop, won’t stop (optimizing)
Our multidisciplinary team of right- and left-brain thinkers united a team of analysts, designers, engineers, and strategists to rapidly identify and implement enhancements. Collaboration with our partner agency, Struck, continuous client feedback, and listening to customers helped us get to where we are today—and we’re just getting started.
Happy clients and customers with full bellies. What more could you ask for?
Work with usTHE RESULTS
 Improved organizational visibility
Data-driven decision making culture adoption
Improved user experience
Improved ad-spend ROI
Improved email success rate
Untapped market segment identification
More efficient meetings