Go Back
Experimentation is both an art form and a science. It is a highly creative process that should be informed by (and evolve with) intentional measurement solutions. Starting with just a hunch or educated guess about improving the user experience, and testing the impact of changes can help inform if changes are on the right track. A great way to elevate your analysis and understanding of test performance is by integrating your A/B testing results with a larger analytics solution.
This post will focus on Google Analytics, but there are integrations/solutions to bring your test results into a multitude of systems. The main point is, bring your analytics A/B test results into whatever tool you are using!
1) Keep all your data in one place
A great advantage of bringing in your test analysis to Google Analytics is developing a single point of truth for analysis and data collection. Bringing your data together for a holistic view of all marketing efforts should always be an ideal that your organization strives for. Utilizing a singular system for analysis typically means greater time efficiencies, requires less data manipulation to combine learnings, and allows for deeper insights through a greater amount of data points simultaneously being analyzed.
By sending your test data to your analytics solution, you can segment your test audience by user info such as device, geography, browser and see their full user journey in addition to key performance metrics. You will be building towards a higher level of data sophistication for your organization. Well done!
Just about every testing platform has documentation available to help you with your integration with Google Analytics. For us at roboboogie, that is often the Optimizely X platform. If you are in the same boat, check out this link to get started.
2) Harness all the work you have done previously to set up GA
Most organizations are already tracking with an analytics solution like Google Analytics. This is an easy way to gauge general site performance metrics alongside user demographic and marketing channel performance.
More likely your organization has a lot of events built into your site analytics that you’d like to know the performance of within your test experiment, such as add-to-carts, purchases, total revenue, form submits, video plays, scroll depth, etc. Rather than building these specific performance events into your A/B testing solution and analyzing these metrics in the confines of the A/B testing tool’s reporting tool, simply connect with your larger analytics solution to take advantage of that previously established tracking schema.
NOTE: Google Analytics standard implementation, as well as out-of-the-box CMS e-commerce integrations, are a great start, but to really understand user behavior specific to your digital properties, it’s very helpful to build events to capture user actions and send them to your analytics property. To learn more about building out custom events in Google Analytics, check out this previous post on jumpstarting your behavioral analysis with custom event tracking.
Another advantage of Google Analytics over A/B testing tools is its ability to analyze categorical events in a much simpler manner. The majority of testing platforms are great at analyzing metrics but struggle to capture categorical events in a meaningful way. Sometimes you want to capture a list of string values and compare the inputs. Google Analytics allows this with a function called Event hierarchy (Event Category, Action, Label), whereas most testing tools will only allow us to increment metrics for comparison, not string values.

For an example, it is common for sites that utilize lots of videos on the site to build an event in GA that captures video plays and passes an event with the following hierarchy (‘video’, ‘play’, ‘{{videoName}}’) where {{videoName}} denotes a dynamic value. In an A/B testing tool you would have to build an event for each possible video and increment each time it’s played to track at that level of detail, but in GA it’s one singular event that captures each unique video name and can return a total count of that string value. You can also segment users who viewed multiple videos, specific videos, etc, which would be extremely difficult to analyze in an A/B testing tool. Once again, utilizing Google Analytics makes life easier!
3) Easily compare performance across channels
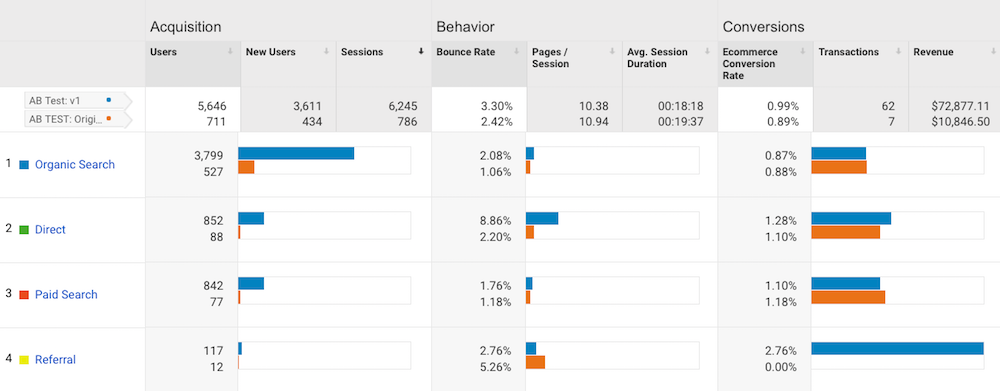
Google Analytics allows for quick comparative analysis across different traffic sources that bring users to our site, and understand trends/performance therein. Applying this to your test audience, you can start to understand if there are underlying differences in performance. For instance, does a user coming via organic search have different trends than someone coming in via social? What about paid search and email? If you’ve spent time mapping your customer journey for your organization, you likely have expectations about what kinds of customers comes to your site, and from which channel. By exploring your test analysis in terms of performance within each channel, you might find that your test performed quite well with a specific channel, and a quite poorly with another channel fueling strategies to begin personalizing experiences for each channel with specific messaging or functionality. Depending on the testing tool you are using, some of this analysis can be done within the platform, but it is much more tedious. Using Google Analytics is quick, easy and easily repeatable for ongoing analysis throughout the lifecycle of an experiment.
4) Analyze highly customized segments
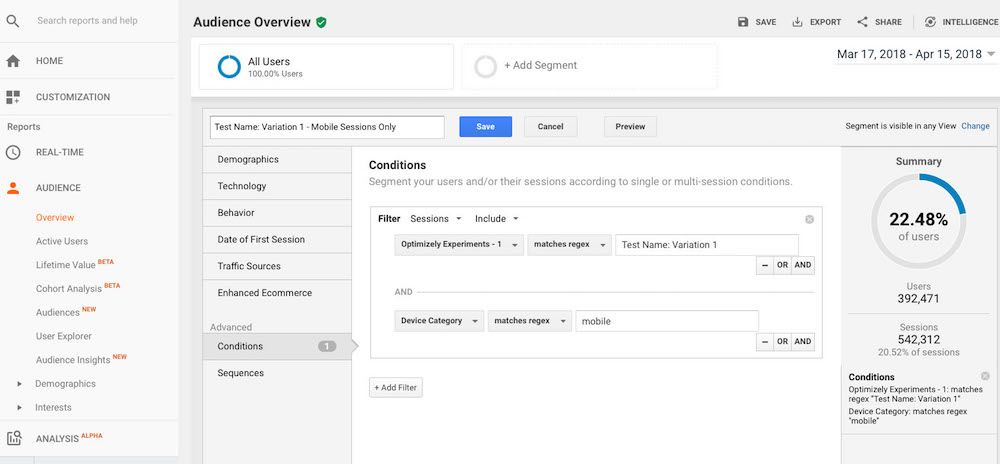
Segments are the real gold of Google Analytics, as it allows you to slice and dice data in very intentional ways. When you know which users were present in our experiments, you can segment by that criteria and a multitude of other criteria such as other unique events your organization has built, user demographic info, device and browser characteristics, engagement with specific pages, and new vs returning user. Multiple conditions can be added together or built out as a linear step-by-step segment (ie. landed on this page, navigated to this page, then converted).
In the realm of A/B/ testing, it is typical to compare specific test variations against one another, which can be accomplished with multiple segments at once. In addition to the test variations, you can add specific criteria such as landing page, browser, device type, ‘saw this explainer video’, etc, which would really hone in on specific audiences to explore and make the standard reports in Google Analytics far more useful.
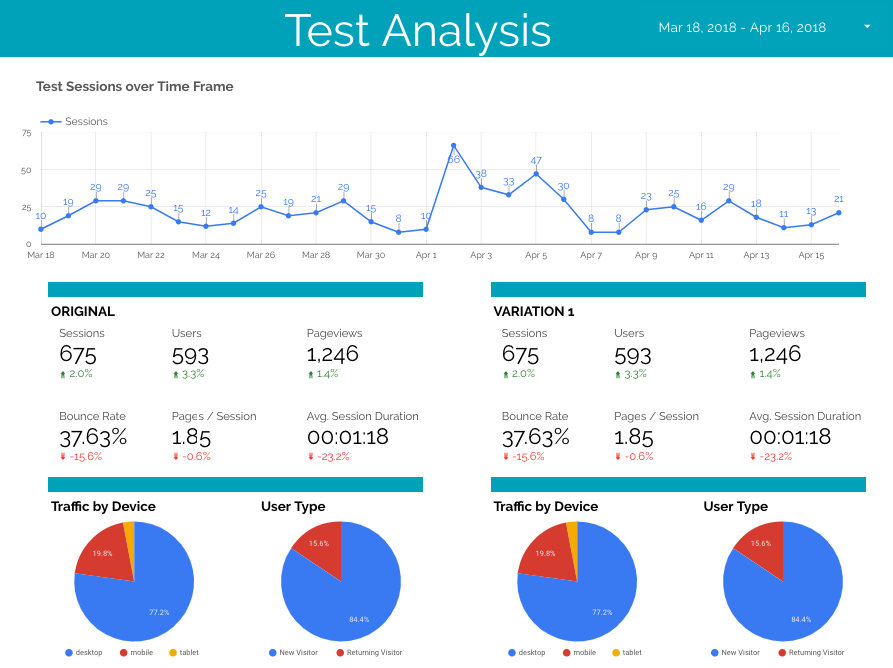
5) Customize and export results reporting with Data Studio
Another great tool from Google, Data Studio allows you to play around with data visualization of custom reports. Now that your experimentation data lives in Google Analytics, you can easily visualize that data alongside your other Google Analytics data to impress your boss and other stakeholders.
Other than Google Analytics, you could also connect other data sources such as Youtube, Facebook, Amazon, a SQL database directly, and all sorts of other data sources via either Google-built connectors or community-built connectors that are available. By bringing in other data sources via the connectors you can build robust and comprehensive reports that will help you holistically analyze your marketing and optimization efforts.
These are just 5 great reasons to pull your experimentation data into your analytics platform. Ultimately, experimentation should bring your organization to changes that drive conversions and improve user experience, and the more robust your learnings, the better.
Need help with implementing measurement or test strategy within your organization? Start a conversation with our team here today and we will help you identify areas of improvement and the action plan to make it happen.


